Einride Saga Insights
Democratizing data for shippers
- From 2022-08 to 2023-08
- Responsible for: discovery, design and testing
- My role: Product designer in the insights team
Problem
- All transport managers and C-level customer stakeholders need detailed emission reports, along with fundamental insights into transport performance.
- Creating custom dashboards for emission and performance KPIs was not scalable, as each customer deployment had unique reporting needs.
- There was an opportunity in the current market for transport visibility tools, as no existing player offered performance insights combined with accredited emission reporting.
These insights led to the bet that there was a market for a modern transport analytics tool, combining the best experiences from data analytics and bringing it to the transport sector.
Solution
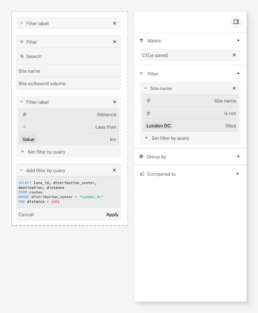
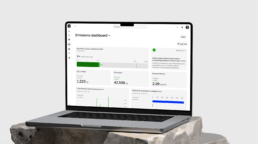
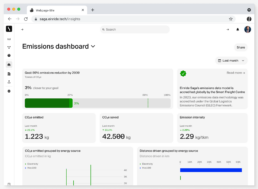
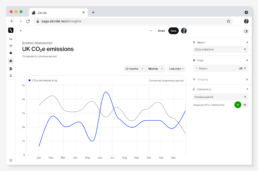
- Einride Saga Insights – a modern analytics tool for the transport sector, combining certified emission reporting with performance insights.
- A flexible and scalable solution that provides users with insights regardless of the customer’s shipping setup.
- Designed to cater to both novice and expert users, including those skilled in data science.
Outcome
Einride Saga Insights has become one of the most widely used products in our suite, helping major clients identify inefficiencies in both performance and emissions.
Customer feedback
This is exactly what’s been missing for us! Do you know how much time we spend on building dashboards, just to never look at them again? This makes accessing relevant data so much easier!
– Logistics manager for one of Swedens largest freight companies.
We have many customers who have started to ask for emission reports lately, and it usually takes us a lot of crunching in excel, and on top of that we have to manually create pdf:s to send them. This saves us a lot of work.
– Sustainability manager from a large Food and Beverage company.
My role
I was the Product designer in a cross functional team with data scientists, front-and backend engineers, PM and engineering manager.
I was responsible for all UX/UI as well as setting up our research repository and product discovery in Notion. My Notion database served as foundation for our common research repository and is now used across product to gather user insights, track competitors, desk resereach etcetera.
Key learnings
- Doing usability testing without real data is pointless. A better way of working is to release functionality behind feature flags, and iterate on the feedback from internal users instead.
- When building complex products all team competencies are equally valuable when gathering and interpreting user insights. Working closely with the engineering manager and data engineers is extremely valuable for me as a designer to understand the data better.
- Having a shared database with insights that can be shared across the team helps everyone focused on user problems and opportunities, but also makes it easier for all team members to contribute with research and insights.